
This is a summary of a cross-sectional survey conducted in 2024 by Vetlife Scientific on behalf of the Deer Industry New Zealand (DINZ)
Following concerns from deer farmers about a novel severe form of lameness in adult stags[1] a national cross-sectional survey was developed by the authors of this study to estimate the prevalence and national distribution of this condition and identify any likely potential risk factors.
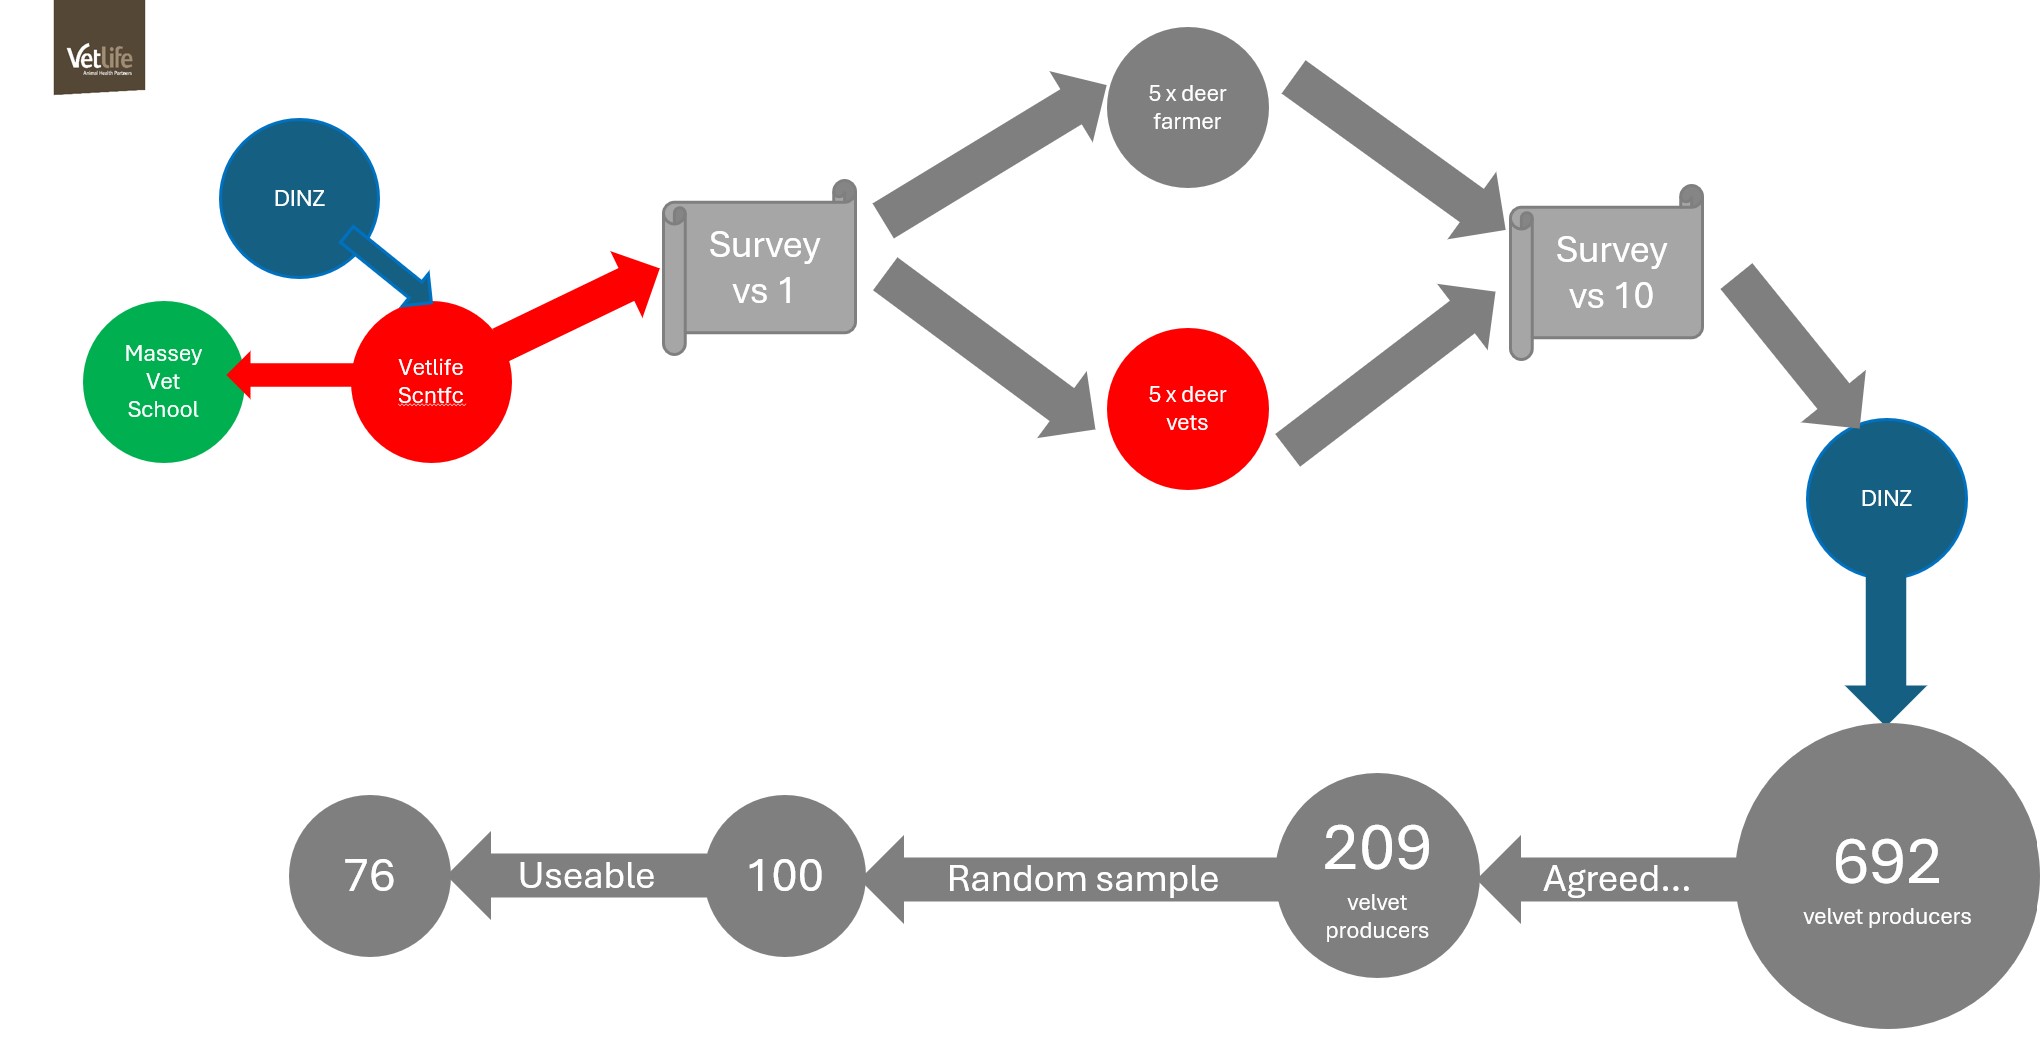
The survey was pre-tested through a focus group of five deer farmers and vets regularly working on deer farms. DINZ staff subsequently attempted to contact all farmers registered with DINZ as both owners of deer and active velvetters (n=692). Of these, 209 were successfully reached and agreed to be eligible for inclusion in a national survey. A randomised sample of 100 of these farms, stratified by N and S Island location, was selected for a subsequent face-to-face interview with their regular vet. The survey period extended from January–April 2024.
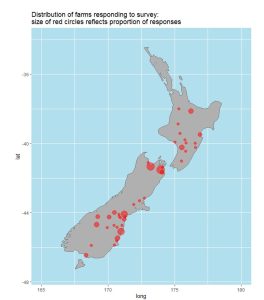
Dots represent farm locations; the larger the dot, the more farms from that area.
All forms of lameness:
39 (95% HDI[2] = 29.3–48.4)%
Exclude trauma (raw injuries)
32 (95% HDI = 22.1–44.2)%
How many stags are lame?
Exclude trauma (raw injuries)
0.14 (95% HDI = 0.05–0.32)%
Lameness is highly clustered on farms, meaning that factors that drive lameness are found at the farm level rather stag level.
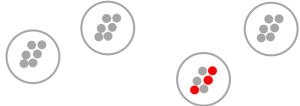
Most farms have < 1% of stags affected in a year but a few have ~ 5% (up to 25%).
While the number of affected farms hasn’t increased since 2019, the number of affected stags has increased. But this could be because of increased awareness, retention of lame stags (prevalence not incidence), or other confounders.
Once adjusted for confounding, including covariates and correlation between predictors, some predicted risk factors were identified.
Distance walked: Herds where the max distance walked was >1500 m were 27 (90% HDI = 3–48)% more likely to ‘lame farms’ than farms where the maximum distance was < 500 m.
Number of yarding events per year: Herds where the number of yarding events per year >12 were 29 (90% HDI = 7–54)% more likely to be ‘lame farms’ than farms where the number of yarding events was < 12.
Herd size (stag numbers): Herds where the number of stags was > 200 were 25 (3–56)% more likely to be ‘lame farms’ than farms where the number of lame stags was ≤ 100.
Region: Herds from the upper SI were 25 (90% HDI = 3–48)% more likely to be ‘lame farms’ than herds from the lower SI.
Other stock classes, stag breed, surface material of tracks, type of supplement fed, type of deer farming (venison/velvet/breeding), type of pasture (unimproved/fescue/ryegrass), endophyte status, were not associated with lameness at the herd level.
These are preliminary findings: the farms surveyed come from across NZ and were randomly selected but from a group that was willing.
The data may contain bias, including motivated responders, recall bias, and selection bias.
The data will also contain the influence of unmeasured confounders, for example yarding frequency also increases observation frequency.
Although preliminary we can say:
To investigate this further:
Andrew Bates, Emily Vallee, Emil Murphy. June 2024
[1] Pania Flint, DINZ eNews, August 2023
[2] Highest density interval: Range of values where the 95% most likely true value lies and the most likely value of all is the median percent.


